The frequencies of highly cited publications of the Institute are similar or higher as compared to the average of some advanced countries
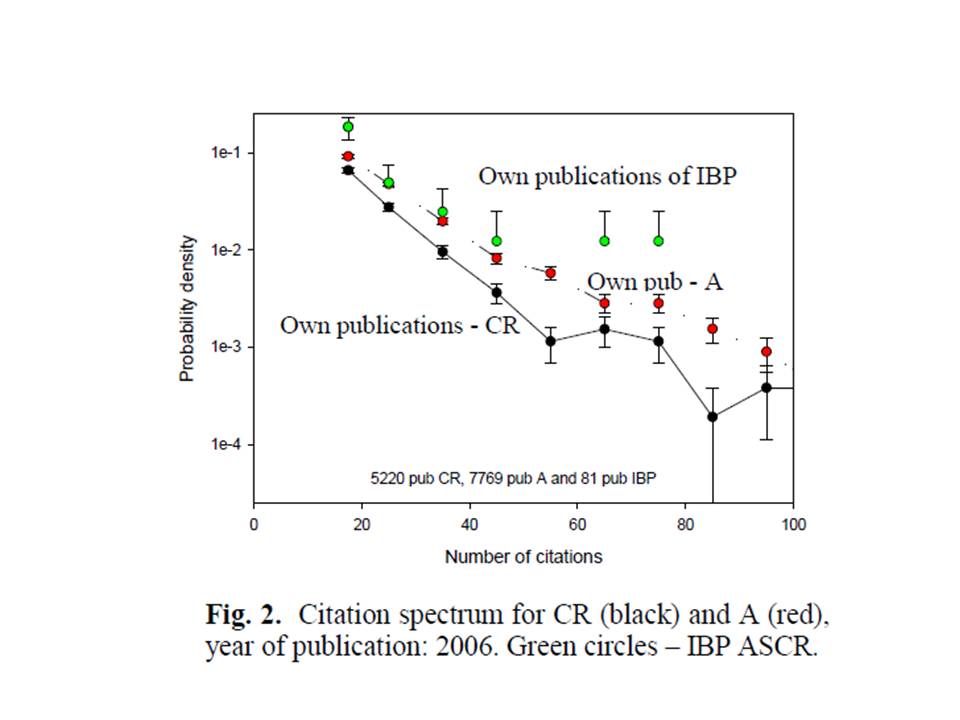
The number of publications cited with some frequency (e.g. between 10-20 citations, 20-30 citations, etc.) divided by the total number of publications represents the probability density of the occurrence of any publication at given interval. This quantity in dependence on the number of citations provides a citation spectrum. Owing to its dependence on time, the citation spectra can be constructed and compared only for a particular year. For high numbers of citations it is difficult to construct the citation spectrum due to growing statistical deviations in this region. Particularly for small organizations, with low total number of publications per year, the citation spectrum can be calculated only up to some limit (up to some number of citations). On the other hand, for small citation frequencies, it is difficult to find all key (own) publications (see “Most cited key publications”), if the total number of publications is high.
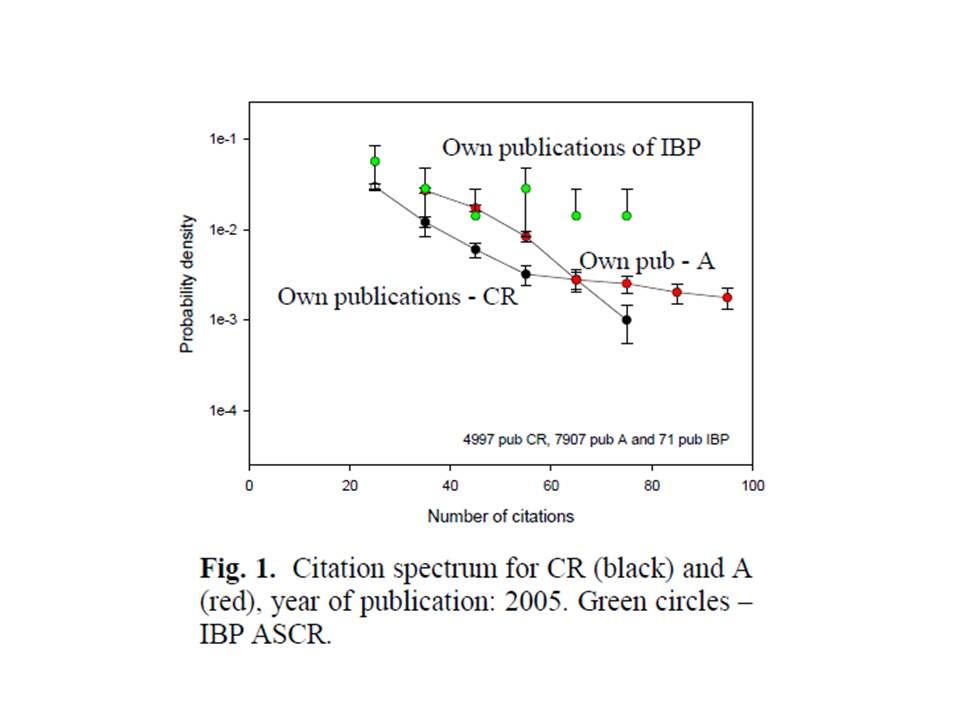
Citation spectra for key publications of the Czech Republic (CR, black circles) and Austria (A, red circles), for 2005-2006, are shown in Fig. 1 and 2. It is clear from these figures that the number of publications with the given number of citations is higher for Austria as compared to the Czech Republic. Owing to large numbers of publications, the standard deviations for smaller citations frequencies are very narrow. The differences between CR and A are, however, evident also for the region around 100 citations per publication. The green circles represent IBP, where the probability densities for higher number of citations could not be calculated. In spite of it, the plots show that IBP has much higher citation frequencies as compared to the average of CR and similar or higher citation frequencies in comparison to the average of Austria, particularly in the region of highly cited publications (50-80 citations). In this region the numbers of publications are 1-2, which means that the statistical errors are very high. The mentioned result is, however, confirmed for both years investigated.